SUMMARY
The operation of the electric power grid is foundational to the health, safety, and economic well-being of the nation, yet it is increasingly fragile and exposed to risk from exogenous factors. When power disruptions are widespread, prolonged, or impact critical services, the consequences can be grave. Geomagnetically induced currents (GICs) arising from geomagnetic disturbances (GMDs) can impact electric power transmission grids through premature ageing and transformer failure, which can lead to cascading failures and extended power disruptions [1].
GMD mitigation poses a challenging problem to grid operators due to the nature of its impact. Space weather events arising from solar coronal mass ejections (CMEs) that intersect Earth's orbit occur on a continuum of timescales and levels of severity. Moderately sized CMEs, such as the 1989 event that lead to the failure of the HydroQuebec system, illustrate the risk to the power grid. Even larger space weather events that have the potential for profound impacts and prolonged power disruptions on a continental scale are thought to happen approximately every one hundred years; however, no such storm has occurred during the existence of electric infrastructure. At the other end of the severity spectrum, recent evidence has shown that GICs flow at low levels continuously on the grid even in the absence of a solar storm. This behavior may cause eventual, but slow to manifest breakdown of grid assets misattributed to non-GMD causes. In either case, it is difficult for utilities to justify the costly installation of sensors and telemetry to monitor this phenomenon.
This paper details a system to augment human operators with two new abilities—(1) the real-time prediction of GICs flowing on their system and (2) the real-time monitoring of GMD grid manifestations—without installing new sensors. The system will do this by fusing a “top-down” approach using physics-based modeling driven by detailed 3-D Earth conductivity measurements and real-time magnetic observatory data with a “bottom-up” approach using artificial intelligence techniques driven by synchrophasor data. This hybrid methodology will enable utility operators to identify the best strategies to modify grid voltages and topology to mitigate damage and deal with a changing federal regulatory framework that requires GMD monitoring and mitigation efforts.
KEYWORDS
geomagnetic disturbance, geomagnetically induced current, synchrophasor, real-time, hybrid, artificial intelligence, machine learning, Earthscope, magnetotellurics
INTRODUCTION
The North American power grid, the oldest man-made machine still in operation, is at significant risk from charged particles emanating from the sun due to solar flares, coronal mass ejections, coronal holes and plasma filament breaks and other phenomena that create the continuously changing “solar wind” or “space weather.” These charged particles interact with and perturb the Earth's magnetic field, producing geomagnetic disturbances (GMDs) that couple with the ground to induce electric fields in the Earth’s crust, mantle, and oceans. The resulting time-varying ground-level electric fields drive quasi-DC geomagnetically induced currents (GICs) in conductive infrastructure such as pipelines and electric transmission lines.
Strong GICs can saturate transformer cores, distorting the AC waveform of the power signal and leading to other problems such as system relay interference, reactive power loss, or even total system collapse [Molinski, 2002]. Previous GMDs have caused damage to power grids and communications systems; the two most widely known being (1) the 1859 Carrington event, which caused widespread damage to the telegraph network, and (2) the 1989 Hydro-Quebec blackout, which left Quebec without power for nine hours and nearly cascaded across the eastern seaboard of the United States [2]. A Carrington-level event today could cause nearly two trillion dollars in damage, damaging or destroying some of North America’s largest transformers, which would require two years to replace[3].
A variety of factors controlling the strength of GMDs, such as the 11-year sunspot cycle, episodic solar coronal mass ejection patterns, and seasonal magnetic field coupling, can combine constructively. GICs induced by GMDs are particularly strong at high latitudes, including the northern part of the continental US and Alaska, where extreme GMD events associated with auroral excitations and electrojet currents are prevalent [4]. At lower latitudes, GICs can be driven by GMDs associated with solar coronal mass ejections and corotating interacting regions [5]. Interplanetary shocks can cause equatorial geomagnetic disturbances whose magnitude at lower latitudes are enhanced by the equatorial electrojet [6]. Such shock waves could occur during a geomagnetically “quiet period” without warning, impacting utilities closer to the equator. Amplification of local peaks during severe GMDs [7] increase the possibility of significant GIC events that can be challenging to predict. GICs may impact power grids lying at mid-latitudes traditionally thought to be at low risk. Even small GICs may be capable of creating longer term transformer damage that effectively reduces the lifespan of the equipment, with equipment failure occurring as a result of, but months after, a GMD [8].
Within the utility industry, space weather/GMD vulnerabilities represent an important issue from a financial perspective, but also because utilities are bound to comply with recent Federal Energy Regulatory Commission (FERC) Order 779 [9], requiring system vulnerability assessment, and National Electric Reliability Corporation (NERC) Response PPL 007-1, requiring GMD monitoring and transformer susceptibility to GICs. At present in the US, there is neither uniformity between different utility approaches to mitigating damage from GMDs, nor the ability to mitigate against such damage in real-time before sensitive components of the grid are stressed. Physically preventing the currents from entering assets by adding series capacitors can harden sections of the grid against GIC-related damage but are expensive and can divert current to unprotected portions of the grid, creating GIC events downstream [10].
Currently, operators have tools that indicate potential GMD "hotspots.” These locations are based on (1) statistical models of likely storm scenarios and (2) power distribution grounding models that assume that electrical conductivity of the Earth's crust and mantle varies only with depth within a broad region. The adoption of such simplifying assumptions has been called into question; now that the US National Science Foundation-supported EarthScope Magnetotelluric Program has mapped real-world 3-D ground electrical conductivity structure across more than half of the continental US, large deviations in calculated GICs are seen relative to previous 1-D models [11].
Calling into question the 1-D conductivity assumption is not the only use for this data. This 3-D conductivity data can be used to project magnetometer measurements from USGS magnetic observatories and compute the geoelectric field for any latitude and longitude within regions where the 3-D ground electrical conductivity has been captured. Thus, with historical USGS data and knowledge of the grid topology, we can reconstruct potential historical or real-time GIC flows for key utility assets. This surrogate for ground truth can then be used to train machine learning algorithms to detect GIC flows using synchrophasor data.
The ability to provide real-time, validated control feedback information to human operators using a framework that could eventually lead to partially or fully automated control loops assisted by machine learning could transform power grid operations and resilience to this threat. Providing a system that allows operators to make dynamic control decisions on a minute-by-minute timescale may help mitigate against damage to power transformers while those system components are actively under stress.
SYSTEM OVERVIEW
“The most that can be expected from any model is that it can supply a useful approximation to reality: All models are wrong; some models are useful". - George Box
GICs flowing through the power grid result from the local and regional electromagnetic coupling with ground, the complicated, 3-D electrical conductivity of the Earth’ crust and mantle, the complex dynamics of the geomagnetic storm, and the topology and instantaneous configuration of the power grid [11]. To solve this problem, we must first acknowledge two challenges.
First, the physics governing the relationship between the flow of charged particles from the sun and the resulting flow of GICs in the utility infrastructure is not completely known. Further, even if it the physics were completely known, we lack the computational capability to simulate from first principles the complete system; thus, any and all models are approximations.
Second, deploying purpose-built sensors across the grid for this purpose is prohibitively expensive. Even if the cost of each sensor fell to zero, the resources required to install each sensor and the disruption to the grid would still make this approach financially unfeasible without considering the additional communications bandwidth that would be required.
To surmount these challenges, two different approaches are being combined to augment the human operator, a design pattern often used in artificial intelligence-based systems.
- The system uses a "top-down" approach to predict GICs based on modeling techniques that use detailed information about the 3-D Earth conductivity and real-time magnetic observatory data streams for enhanced fidelity over current models employed by the power industry that approximate the Earth conductivity as 1-D (i.e. varying only with depth within a given region).
- The system fuses this with a "bottom-up" approach to detect GMD manifestations on the grid in real-time using data from synchrophasors and other previously deployed sensors on the grid, augmented by advance warning of looming GMDs from satellite-mounted sensors.
This system described in this paper is shown in the figure below and represents a unique public-private partnership.
MODELING-BASED (TOP-DOWN) APPROACH
There are two approaches to modeling the intensity of electric fields at ground level that drive GICs through the power grid. The first approach is to numerically solve the coupled system of differential equations that represents the physics of electromagnetic induction above a 3-D conducting Earth, given a model of the inducing electric or magnetic fields in the ionosphere and an existing model of the 3-D variations in electrical conductivity of the Earth's crust and upper mantle. The result is a time-series of vector electric fields, at ground level, along the pathways of power transmission lines. This approach is computationally expensive and demands large amounts of fast computer memory to implement. The underlying ground conductivity models are ultimately derived through inverse modeling of observations of time variations in ground level electric and magnetic fields determined through magnetotelluric measurements [11], and are intrinsically inexact, volume-averaged estimates of real-world conductivity variations. Furthermore, exact knowledge of the instantaneous complex form of ionospheric electric fields that induce GICs in the grid is illusive at best. A second approach to solving this problem lies in eliminating use of ground conductivity models entirely, but rather directly using the magnetotelluric information from which those models were subsequently derived.
For the top-down (physics-based modeling) approach, we are using both previously collected and real-time data to predict GIC flows in the power grid. The foundation of this modeling approach comes from the 3-D mapping of the electrical conductivity of the Earth’s crust and mantle by the NSF’s EarthScope magnetotelluric (MT) program [12]. MT data are obtained by measuring the naturally occurring time variations in the Earth’s vector electric and magnetic fields at ground level on a grid of temporary observation locations. These electric and magnetic field measurements are used to determine the MT impedance tensor for each site (Equation 1, below), which provides information on the electrical conductivity structure of the Earth’s crust and mantle. These data drive a computationally efficient model, developed by OSU that predicts ground electric fields along the paths of power lines in real-time using inexpensive PC-class computers. Schultz and Bonner (2017) describe this method of real-time projection of magnetic field data streams from US Geological Survey (and other) permanent networks of magnetic observatories, into a cascading set of two linear filters that:
- Finds the best fitting (in a robust least squares sense) linear filter coefficients that map ground magnetic field data recorded previously on temporary (typically, operating for ~3-4 weeks) rolling networks of 10-30 MT stations at a time (such as the aggregated collection ~1000 temporary/portable MT stations that have covered half of the area of the continental US under the support of the NSF EarthScope Program - Figure 2 below) and magnetic field data recorded over the same time interval by the much sparser network of permanent magnetic observatories that most closely surrounds the region of interest, and that then...
- applies that linear filter to real-time magnetic observatory data to generate real-time predictions of ground magnetic field values at the locations where EarthScope (or other) magnetotelluric stations had previously operated, following which…
- the predicted magnetic fields are projected through MT impedance tensors previously calculated from the MT data collected at the MT stations (equation 1 below), thus yielding predictions of ground electric fields at those sites; such predicted fields are then…
- projected to the line paths of high voltage lines that lie inside the aperture of the MT array, using a nearest neighbor distance-based weighted interpolation. The electric fields are then integrated along the line paths to yield a time varying voltage which is used as input to an equivalent circuit that describes the power grid configuration, yielding a real-time GIC prediction.
These steps described the Cascading Linear Filter Algorithm of Bonner and Schultz (2017), which can be illustrated through the flow diagram in Figure 3.
An example of the CLFA prediction process appears in Figure 4. Here, the predicted electric field is compared to the value recorded at a temporary magnetotelluric station installed near a Bonneville Power Administration [BPA] high voltage line near Portland, Oregon. We compare the quality of that prediction to a similar one that employs a 1-D ground conductivity model EPRI [13] following procedures outlined by NERC in 2015. The CLFA prediction, as is typically the case for examples run within this BPA region as well as within the ATC operating region in Wisconsin and Michigan, yields a much lower misfit than the current industry standard based on a 1-D model of ground conductivity.
Usually the time-domain simulation of power systems requires the computationally expensive integration of nonlinear differential, algebraic, and discrete equation systems. These systems provide useful information about equipment fault dependencies, cascading regimes, and several failure mechanisms that involve specific time constraints. On the other hand, statistical models and quasi--steady-state (QSS) models are useful to simulate power system behavior that provides failure stages or expected blackout areas while keeping a lower computational burden and avoiding some of the numerical instabilities of dynamic simulators. We plan to leverage a customized suite of power system simulators (open source and commercial) that respond to particular hypotheses by exploiting horizontal (geography, electrical distance) and vertical (voltage levels) partitionings of the system [14].
DATA-DRIVEN (BOTTOM-UP) APPROACH
If a physical process can be perfectly predicted or is purely deterministic, there is no need to deploy sensors and collect data to describe the process. In the case of GIC, this is clearly not the case and sensors are required to capture the behavior of the system. Fortunately, several thousand synchrophasors have already been deployed across the North American transmission system. Further, the actual total of deployed phasor measuring capability is much higher; Dr. Edmund O. Schweitzer III at the March 2017 American Transmission Summit in Washington DC mentioned that there were over 500,000 smart assets deployed on the grid today built by Schweitzer that contained synchronized phasor measurement capabilities. While many of these embedded PMUs are not actively transmitting data, there is no doubt that significant sensor coverage exists on the grid.
For the bottom-up (data-driven) approach, we wish to measure GIC impact on the power grid with general purpose sensors already deployed by utilities with the help of the Department of Energy. The power industry long believed that the impacts of GMDs were not visible within synchrophasor data. Part of this belief arises from the fact that GMDs can cause transformer half cycle saturation, inducing system harmonics that are integer multiples of the 60 Hz fundamental frequency of the power grid that are significantly above the Nyquist frequency of synchrophasor data sampled 30 to 60 times per second. However, by using synchrophasors on the high- and low-side of an autotransformer, reactive power consumption could be computed that demonstrated strong correlation (>0.8) to the rectified GIC flow as shown in figure 5.
Further, PingThings has demonstrated that geomagnetically induced currents are not, as it is commonly believed, an infrequent occurrence. Instead, GIC’s of varying magnitudes are omnipresent on utility infrastructure, with unknown long-term exposure effects.
While these results help expand industry understanding of this phenomenon, many assets do not have high- and low-side PMUs actively collecting data and a different approach is needed to detect GMD activity within synchrophasor data. As the exact manifestation of GIC within PMU data (the signature) is unknown, we turn to machine learning (ML).
ML-based approaches do not require prior knowledge of the exact signature of the event to be detected. Instead, the machine learning algorithms are shown synchrophasor data containing known GMD events (training data) and learn the pattern indicative of a GIC flow. For this supervised training approach to work, ground truth must be known and this has been the limiting reagent to date; despite the best efforts of some in the industry, the required sets of overlapping data are scarce and ML improves with larger data set. This ground truth data set requires not only synchrophasor data that is of sufficient quality for analysis and not temporally down sampled but also neutral current data captured and archived during a GMD event. However, this data set is no longer required; the modeling approach described in the previous section, driven by real-time magnetometer data and the 3D magnetotelluric data can provide as much ground truth data as needed assuming the actual grid topology is known.
REQUIREMENTS
To fuse the top-down and bottom-up GIC prediction and monitoring approaches in real-time requires data architectures and computational systems that far exceed the current capabilities of the utility industry. The system must not only ingest thousands of high sample rate time series but also deploy computing, analytics and machine learning algorithms in real-time to perform data quality assurance and event detection and quantification.
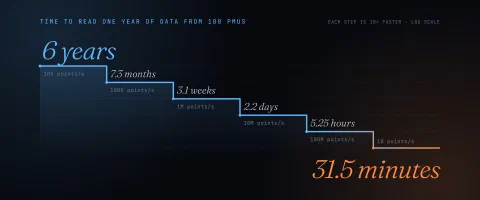
From a data perspective, this system requires a tremendous amount of both streaming (continuously growing) and static data from multiple organizations. Synchrophasors alone can stream up to 150MB/s of sensor time series data that must be cleaned, processed, and stored in real-time. Approximately 50-GB of raw long-period MT data (1 sample per second) and 2-TB of wideband (4096 sample per second) MT data has thus far been acquired from ~1000 MT stations in the continental US, and this quantity grows continually.
From a computation perspective, the system faces both real-time and offline (or asynchronous) demands. The top down modeling approach requires the Cascading Linear Filter Algorithm to be run within a sufficient time budget of about 1 second (the sampling rate of the USGS magnetometer data streams). As PMU data is ingested, the floating-point values composing each stream must be interrogated for data quality issues and, if found, the data in question must be flagged and potentially filled via data conditioning techniques. This data quality assurance must happen before the data is used for any other purpose. Finally, the data-driven approach requires machine learning. Training ML algorithms with data can be time consuming, especially for deep learning. Fortunately, this can be done offline or asynchronously. However, detection must occur in real-time and, thus, has a finite time budget for this stage of the ML-oriented computations. Given that the response time to the acute, local GMD impacts by utility operators will likely be measured in minutes, an approximately several second lag in real-time operation is acceptable for detection and prediction.
Essential to any data-related work is the iteration time between experiments or analyses or machine learning training epochs. Data must be pulled, visualized, understood, comprehended, manipulated, analyzed, and then used. If any of these steps in this process are slow, the ability to iteratively refine the work is blocked. Thus, the system must not only be able to ingest and store this data but then also allow rapid, easy, and intuitive access to the data so that developers, analysts, and engineers can efficiently complete required tasks.
Finally, an intuitive and dynamic human machine interface is required to provide information visualization and decision support to utility engineers and control room operators. As the exact interface is unknown, the design will have to be iterated upon until it converges to meeting the requirements of the end users.
ENABLING TECHNOLOGIES
A system composed of almost exclusively open source software can not only meet the requirements described above—data storage, handling, and analysis and large-scale computation—but do so while minimizing the overall cost of the solution. The reason that this is possible is that open source now often represents the state of the art in software and leverages the tremendous advances that have occurred in software engineering over the last 15 years from technology companies such as Google and Facebook.
One of the key advances has been the trend toward virtualization and now containerization that makes it significantly easier to build distributed computing systems with polyglot microservice architectures. Containers are a lighter-weight virtualization technology than virtual machines that allow the user to run an application and its dependencies in a resource-isolated process. Unlike a virtual machine, the containers on a single machine share the host operating and file systems. Containerization offers a tremendous number of advantages for microservice architectures including:
- Enhanced resiliency and stability,
- Rapid application development,
- Portability across computer architectures,
- Version control and component reuse,
- Simplified maintenance,
- Easier horizontal scalability, and
- Faster deployments
Fundamentally, containers help development and deployment move from a machine orientation to an application focus; in the words of Google, “because well-designed containers and container images are scoped to a single application, managing containers means managing applications rather than machines.”
One of the very convenient benefits that arises from such containers and microservices is horizontal scalability. This ability to handle more data or more computation by simply adding additional, inexpensive commodity computers exponentially reduces the costs of handling data at scale compared to the typical proprietary and monolithic data historian found at the heart of most utilities’ data architectures.
This system in question uses Kubernetes as the container orchestration layer and the Docker engine to run containers. Apache Kafka serves as the horizontally scalable data ingest system, able to handle data from an unlimited number of formats, including C37.118, the IEEE Standard for Synchrophasor Measurements for Power Systems. Next, we use the Berkeley Tree Database (BTrDB) as the data storage engine, which, due to its novelty and recent introduction, will be discussed more in the next paragraph. For advanced analytics and general computational capabilities, we employ Apache Spark, a fast and general-purpose engine for large scale data analysis. Spark has prebuilt libraries to handle both graph-based processing and in-memory machine learning approaches plus the ability to handle real-time data in micro-batches. Google’s TensorFlow augments Spark’s ML capabilities with deep learning. Finally, the human-facing interface is implemented as a mobile-first, web-based application to leverage the significant strides made in user interfaces as a result of available touch screens.
Time series and other sensor data are archived with version control on the Berkeley Tree Database (BTrDB) server. BTrDB collects and stores many concurrent, high-bandwidth, potentially unordered streams without data concentrators, 1400x faster than the best commercial solution (Cassandra) and with unprecedented storage efficiency. It uses a novel time-partitioned index that provides consistent versioning, extremely fast change-set identification for robust on-the-fly distillation, and multi-resolution statistical summaries that enable fixed response-time queries and logarithmic isolation of rare critical events in massive time-series, independent of the size of the underlying data. For example, locating the handful of voltage sags in 3.4B points comprising a year of data requires less than 200ms [15].
In benchmark tests of BTrDB alone, performance of 53 million inserted values per second and 119 million queried values per second have been sustained on a small, 4-node cluster. Further, we have performed scale testing with our current data platform to demonstrate that it can handle the simultaneous ingestion of nearly 5,000 synchrophasors; to place this in perspective, there are estimated to be approximately 3,000 transmission PMUs currently deployed and active in North America.
CONCLUSION
The entire team, PingThings, Oregon State University, and the American Transmission Company, is excited to have the opportunity to continue to develop this system and capability for not only the National Science Foundation but also utilities around the world. While this effort is aimed specifically at developing a system and platform to address an established threat to critical infrastructure—GICs produced by GMDs—using an approach that fuses best of breed physics based-models with real-time sensor driven feedback, we hope that the work opens up future possibilities for evolving the power grid (and potentially other critical utilities) into smarter system(s) that can handle ever greater stochastic challenges to reliable operation. Control systems that are tolerant of and can mitigate against stochastically distributed (in time and space) adverse events need to be built from closely knit and balanced interactions between data describing the real world, models of how the world is understood to operate, and the human controller. While there are significant advances in stochastic modeling techniques, the human mind still surpasses most models. However, this does not mean that machines cannot learn from their human counterpart and vice versa.
BIBLIOGRAPHY
- [1] Pulkkinen A., Pirjola R., Viljanen A., Determination of ground conductivity and system parameters for optimal modeling of geomagnetically induced current flow in technological systems, Earth Planets and Space 59, 999 – 1006 (2007).
- [2] Boteler D., Pirjola R., & Nevalinna H., The effects of geomagnetic disturbances on electrical systems at the Earth’s surface, Adv. Space Res. 22, 17-27 (1998).
- [3] Green JL, Boardsen S, Odenwald S, Humble J, Pazamickas KA, "Eyewitness reports of the great auroral storm of 1859," Advances in Space Research, Volume 28, Issue 2, 2006.
- [4] Ngwira C., et al., Extended study of extreme geoelectric field event scenarios for geomagnetically induced current applications, Space Weather 11, 121 – 131 (2013).
- [5] Kataoka R. & Pulkkinen A., Geomagnetically induced currents during intense storms driven by coronal mass ejections and corotating interacting regions, Journal of Geophysical Research 113, A03S12 (2008).
- [6] Carter, B. A., E. Yizengaw, R. Pradipta, A. J. Halford, R. Norman, and K. Zhang. "Interplanetary Shocks and the Resulting Geomagnetically Induced Currents at the Equator." Geophys. Res. Lett. Geophysical Research Letters42.16 (2015): 6554-559. Print.
- [7] Ngwira C., et al., Characteristics of extreme geoelectric fields and their possible causes:Localized peak enhancements, Geophysical Research Letters 42, (2015).
- [8] Gaunt, C. T., and G. Coetzee. "Transformer Failures in Regions Incorrectly Considered to Have Low GIC-risk." 2007 IEEE Lausanne Power Tech (2007). Print.
- [9] Federal Energy Regulatory Commission Order No. 779, Reliability Standards for Geomagnetic Disturbances, Issued May 16, 2013, https://www.ferc.gov/whats-new/comm-meet/2013/051613/E-5.pdf.
- [10] Pirjola R., Boteler D., et al., Prediction of geomagnetically induced currents in power transmission systems, Adv. Space Res. 26, 5 – 14 (2000).
- [11] Bonner, L R. IV & A. Schultz, Rapid prediction of electric fields associated with geomagnetically induced currents in the presence of three-dimensional ground structure: Projection of remote magnetic observatory data through magnetotelluric impedance tensors, Space Weather, 2017.
- [12] Schultz, A., P. Bedrosian, K. Key, D. Livelybrooks, G.D. Egbert, E. Bowles-Martinez, P.E. Wannamaker, Magnetotelluric investigations of convergent margins and of incipient rifting: Preliminary results from the EarthScope MT Transportable Array and MT FlexArray deployments in Cascadia and in the North American Mid-Continent Region, Amer. Geophy. U., Fall Meeting 2014, abstract #GP31A-3676 (2014).
- [13] EPRI, One-Dimensional Earth Resistivity Models for Selected Areas of Continental United States and Alaska. EPRI, ed R. Lordan, Palo Alto, CA. 1026430 (2002).
- [14] Song, J., Cotilla-Sanchez, E., Ghanavati, G., & Hines, P. D. H. (2016). Dynamic Modeling of Cascading Failure in Power Systems. IEEE Transactions on Power Systems, 31(3), 2085–2095.
- [15] Andersen M and Culler D, BTrDB: Optimizing Storage System Design for Timeseries Processing, Fast '16 14th USENIX Conference on File and Storage Technologies, Feb 2016